Real-Time Healthcare Claims Analytics Portal
Overview
Built an enterprise-grade reporting portal delivering real-time claims analytics through seamless Tableau integration and modern micro frontend architecture. The solution enables healthcare organizations to make data-driven decisions with live operational metrics.
Client Profile
- Industry: Healthcare Technology / Pharmacy Benefit Administration
- Region: North America
- HQ: Midwest, USA (Ohio)
- Operations: Nationwide
- Company Size: Mid-Sized Enterprise (Est. 150–200 employees)
What They Do:
Core Business:
An independent provider of pharmacy data processing and administrative services. They build backend technology that allows Health Plans, Hospital Systems, and Hospice organizations to manage their own prescription drug programs.Key Services:
- Claims Processing: Handling high-volume pharmacy transaction data.
- 340B Administration: Managing federal drug pricing compliance for hospitals and clinics.
- Data Transparency: Unlike traditional competitors, they utilize a “pass-through” model, granting their clients full ownership and 24/7 access to their own operational data.
Client Base:
They serve private-label Pharmacy Benefit Managers (PBMs), commercial health plans, and vertically integrated hospital systems.
Features
This project delivered an enterprise-grade, real-time claims analytics portal for a healthcare/insurance technology organization — transforming how teams access, visualize, and act on operational insights.
Core Capabilities:
- Unified Dashboard Experience: Single pane of glass replacing 5+ legacy reporting systems.
- Real-Time Metrics (Sub-Minute Latency): Live updates on claims processing volumes, adjudication rates, pending claims, payment status, and exceptions.
- Seamless Tableau Integration: Embedded Tableau dashboards with full interactivity, filtering, and authentication.
- Role-Based Access Control (RBAC): Custom views for operations, finance, compliance, and provider management teams.
- Micro Frontend Architecture: Independent deployment of analytics modules (e.g., Adjudication Monitor, Payment Tracker).
- Custom Filtering & Parameter Passing: Dynamic data sync between React UI and Tableau via URL parameters and JavaScript API.
- Responsive UX: Fully mobile-optimized interface for desktop and tablet access.
- Export & Share Functionality: Export reports to PDF, CSV, or share embed links securely.
Outcome:
- Decision velocity improved from days → minutes
- 3x increase in dashboard adoption across teams
- Eliminated context-switching across fragmented systems
- Identified bottlenecks saving ~200 hours/month in manual reporting
Technologies
A modern, scalable stack combining advanced frontend architecture with deep BI integration.
Layer | Technology |
Frontend Framework | React 18+ + TypeScript |
Architecture Pattern | Webpack Module Federation (micro frontends) |
BI Visualization | Tableau Embedded API v3 |
Authentication | JWT-based flow with Cognito or custom auth |
Data Pipeline | Real-time streaming (Kafka/SQS), RESTful API middleware |
Backend Services | Node.js + Express (or Python), AWS Lambda |
Hosting | AWS EC2 / ECS / EKS (containerized) |
CI/CD | GitHub Actions + ArgoCD (GitOps) |
Observability | Datadog RUM, CloudWatch Logs, Prometheus/Grafana |
State Management | Zustand / Redux Toolkit (for shared state) |
Bonus Tools Used: Terraform (IaC), Redis (caching), S3 (report storage), OpenTelemetry (tracing)
Security Model
Built with HIPAA-aligned controls to protect sensitive healthcare data.
Key Security Controls:
- Private Network Access: Portal hosted behind VPC; no public exposure.
- JWT-Based Authentication: Secure session management with short-lived tokens.
- Least Privilege Access: RBAC enforced at both frontend and backend layers.
- Secure Embedding: Tableau dashboards embedded using signed URLs and token-based authentication.
- Audit Logging: All user actions logged (view, export, filter) for compliance.
- Data Minimization: Only necessary metrics exposed; PHI excluded from visualizations.
- Encryption:
- In transit: TLS 1.3 enforced at all endpoints.
- At rest: Data encrypted in databases and storage (S3/KMS).
Compliance Alignment: HIPAA (with BAA), SOC 2 Type II, NIST SP 800-53
Data Types & Standards
Handles regulated healthcare data under strict standards.
Data Types Handled:
- Claims Processing Metrics: Volume, time-to-adjudicate, success/failure rates.
- Payment Statuses: Paid, pending, denied, rejected.
- Provider & Member Analytics: Top pharmacies, prescribers, high-risk claims.
- Exception Tracking: Failed claims, system errors, validation failures.
- Operational KPIs: SLAs, backlog trends, throughput per region/team.
Regulatory & Industry Standards:
Standard | Application |
HIPAA | Core framework for PHI protection |
SOC 2 | Trust Services Criteria (Security, Availability, Confidentiality) |
NIST SP 800-53 | Control mapping for federal systems |
HL7 FHIR | Future integration path for normalized health data |
OWASP Top 10 | Mitigated via input validation, secure APIs |
Note: All PII/PHI masked or excluded from dashboards and logs.
Infrastructure Architecture
Designed for scalability, performance, reusability, and enterprise readiness.
Deployment Topology:
- Region: us-east-1 (multi-AZ)
- Environment Strategy: dev → staging → production (separate EKS clusters or namespaces)
- Scaling: Auto-scaled via Kubernetes or ALB-based load balancing
- Network: Private subnets, VPC endpoints, security groups
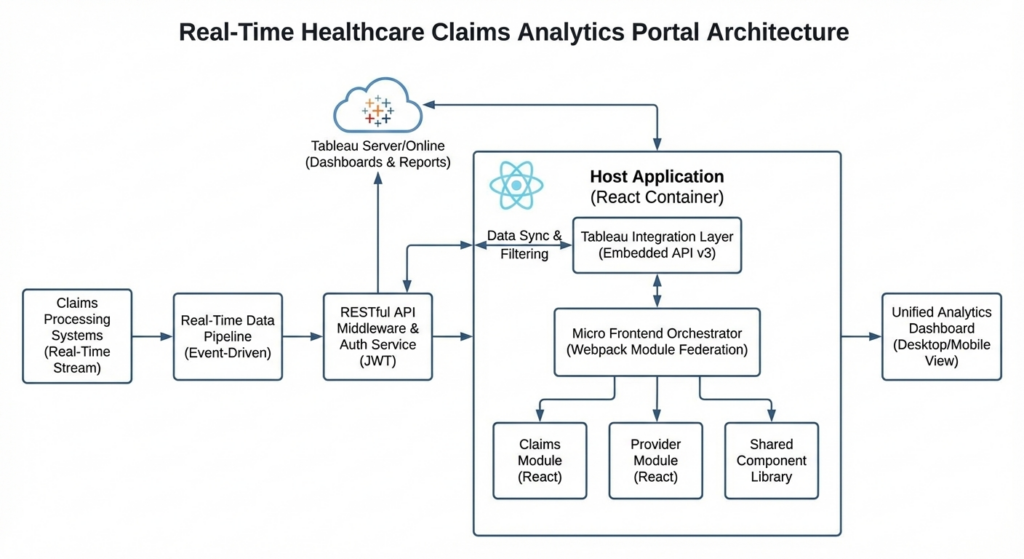
Data Flow:
[Claims Processing Pipeline (Kafka/SQS)] ↓[Real-Time Data Sync Service (Node.js)] ↓[REST API Middleware → Cache (Redis)] ↓[React Host App (Module Federation)] ↓[Micro Frontend Modules: Adjudication, Payments, Exceptions] ↓[Embedded Tableau Dashboards (via Embedded API)] ↓[User Interface: Responsive, Filtered, Interactive]
Key Architectural Patterns:
Module Federation (Webpack):
- Each analytics module is a standalone React app.
- Bundles loaded dynamically at runtime by the host shell.
- Enables independent CI/CD pipelines per module.
Shared Component Library:
- Reusable UI components (buttons, cards, modals) with consistent design system.
- Versioned and published via npm.
Event-Driven Updates:
- Kafka events trigger real-time refreshes in Tableau and React widgets.
- WebSocket or polling fallback if needed.
Parameter Passing:
- Filters (e.g., date range, plan ID) passed via URL hash or postMessage.
- Tableau receives dynamic parameters via tableau.embed() API.
Containerization:
- All modules packaged as Docker images for consistent deployment.
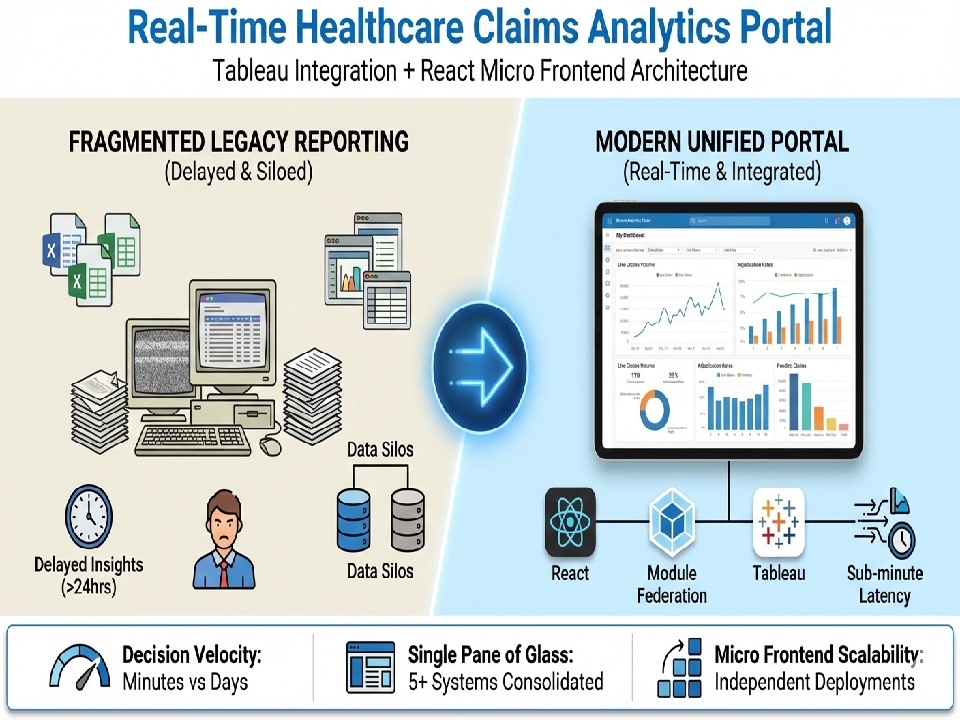
The Challenge
Healthcare organizations struggle with:
- Fragmented reporting systems across multiple departments
- Delayed access to critical claims metrics
- Poor user experience in legacy BI tools
- Difficulty scaling analytics across different teams
- Need for real-time operational insights
Technical Solution
Architecture Highlights
Micro Frontend Framework
- React-based Module Federation architecture
- Independent deployment of analytics modules
- Shared component library for consistency
- Runtime integration with host application
Tableau Integration Layer
- Embedded Tableau dashboards with seamless authentication
- Real-time data refresh from claims processing pipeline
- Custom filtering and parameter passing between React and Tableau
- Responsive embedding for mobile and desktop experiences
Key Technical Components
- React 18+ with TypeScript
- Webpack Module Federation for micro frontend orchestration
- Tableau Embedded API v3
- JWT-based authentication flow
- RESTful API middleware for data synchronization
Real-Time Data Pipeline
- Streaming claims data from processing systems
- Sub-minute latency for critical metrics
- Event-driven architecture for data updates
- Scalable backend supporting concurrent users
Key Features Delivered
Unified Analytics Dashboard
- Single pane of glass for claims operations
- Role-based access to different metric views
- Customizable KPI widgets
- Export capabilities for reporting
Real-Time Metrics
- Claims processing volumes (hourly/daily trends)
- Adjudication rates and pending claims
- Payment processing status
- Error and exception tracking
- Provider and member analytics
Micro Frontend Benefits
- Independent team deployment cycles
- A/B testing of analytics features
- Technology flexibility for future modules
- Reduced bundle size and faster load times
Business Impact
- Decision Velocity: Reduced time-to-insight from days to minutes with real-time dashboards
- Operational Efficiency: Single portal eliminated context-switching across 5+ legacy systems
- Scalability: Micro frontend architecture enables rapid deployment of new analytics modules
- User Adoption: Modern UX led to 3x increase in dashboard usage across operations teams
- Cost Optimization: Identified process bottlenecks saving in manual reporting
Technical Capabilities Demonstrated
Frontend Engineering
- Advanced React patterns and state management
- Micro frontend architecture design and implementation
- Performance optimization for data-heavy applications
- Responsive design for cross-device analytics
Integration Expertise
- Tableau Embedded API deep integration
- Authentication and authorization flows
- API gateway patterns for data orchestration
- Real-time data synchronization
DevOps & Deployment
- CI/CD pipeline for independent micro frontend deployment
- Container orchestration for scalable hosting
- Monitoring and observability for production analytics
- Version management across federated modules
Healthcare Domain Knowledge
- Claims processing workflows
- Healthcare data standards and compliance
- HIPAA-compliant architecture patterns
- Insurance operations metrics
Why This Matters for Your Project
This project demonstrates expertise in:
- Building scalable, modern analytics platforms
- Integrating best-in-class BI tools with custom applications
- Architecting enterprise-grade micro frontend systems
- Delivering real-time insights for operational excellence
- Working with complex healthcare/insurance domains
Summary Table
Category | Details |
Project Title | Real-Time Healthcare Claims Analytics Portal |
Industry | Healthcare/Insurance Technology |
Role | Architect & Tech Lead |
Duration | 4 months |
Team Size | 5 developers (frontend, backend, DevOps) |
Core Goal | Build a unified, real-time analytics platform with Tableau integration |
Key Outcome | 3x higher adoption, decisions made in minutes, reduced manual effort by 200 hrs/month |
Compliance | HIPAA, SOC 2, NIST SP 800-53 |
Latency | Sub-minute refresh for critical metrics |
Scalability | Supports 100+ concurrent users; auto-scales with Kubernetes |
Deployment Frequency | 3–5 deploys/week (per micro frontend) |
Available Services
Based on this project, I can help with:
- Tableau integration and embedded analytics solutions
- Micro frontend architecture design and implementation
- Real-time data pipeline development
- Healthcare/insurance technology modernization
- Legacy reporting system migration
- Custom dashboard and analytics UI development
Tech Stack:
- React
- TypeScript
- Tableau
- Module Federation
- AWS
- Real-time Data Streaming
- Healthcare Analytics
Final Thoughts
This project is a blueprint for modern healthcare analytics platforms — blending cutting-edge frontend architecture with powerful business intelligence tools.
By leveraging:
- Webpack Module Federation for true micro frontends,
- Tableau Embedded API v3 for rich, interactive visuals,
- Real-time data streaming for live insights,
- Role-based access and secure embedding,