End-to-End Datadog Monitoring & Observability Integration in Multi-Environment Microservices Architecture
Overview
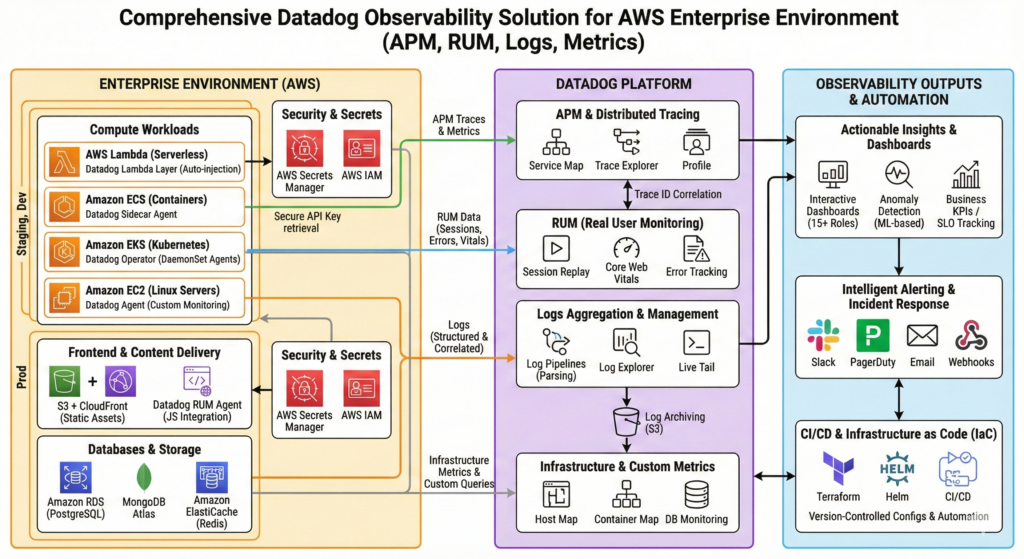
We led the full lifecycle design, implementation, and deployment of a comprehensive observability platform using Datadog across a complex, distributed enterprise-grade environment spanning AWS EC2, ECS, EKS, and serverless Lambda functions. The goal was to unify application performance monitoring (APM), real user monitoring (RUM), logs, infrastructure metrics, custom alerts, and dashboards across multiple environments (dev, staging, production) ensuring end-to-end visibility into system health and user experience.
Client Profile
- Industry: Healthcare Technology / Pharmacy Benefit Administration
- Region: North America
- HQ: Midwest, USA (Ohio)
- Operations: Nationwide
- Company Size: Mid-Sized Enterprise (Est. 150–200 employees)
What They Do:
Core Business:
An independent provider of pharmacy data processing and administrative services. They build backend technology that allows Health Plans, Hospital Systems, and Hospice organizations to manage their own prescription drug programs.
Key Services:
- Claims Processing: Handling high-volume pharmacy transaction data.
- 340B Administration: Managing federal drug pricing compliance for hospitals and clinics.
- Data Transparency: Unlike traditional competitors, they utilize a “pass-through” model, granting their clients full ownership and 24/7 access to their own operational data.
Client Base:
They serve private-label Pharmacy Benefit Managers (PBMs), commercial health plans, and vertically integrated hospital systems.
Challenge:
The existing infrastructure lacked unified monitoring, resulting in fragmented visibility across 15+ microservices, delayed incident response (MTTR >4 hours), and limited insight into user experience issues affecting business KPIs.
To achieve this, we implemented multi-layered Datadog integrations:
Application Performance Monitoring (APM):
- We instrumented backend services using the Datadog SDK to generate distributed traces across microservices, capturing service dependencies, request flows, and performance bottlenecks.
- For serverless workloads (AWS Lambda), we integrated via a custom Serverless Framework plugin that auto-injected the required Datadog Lambda layer at deployment time, enabling cold-start monitoring and execution tracing.
- On ECS, we deployed a sidecar container (Datadog Agent) in task definitions, securely retrieving API keys from AWS Secrets Manager with IAM role-based authentication.
- On EKS, we deployed the Datadog Operator, which managed DaemonSet-based agents across all nodes (20+ nodes), enabling automatic instrumentation and telemetry collection with zero application code changes.
Real User Monitoring (RUM):
- We integrated the Datadog RUM agent directly into the frontend JavaScript codebase (React/Angular), capturing user interactions, page load times, JavaScript errors, and Core Web Vitals.
- Our Frontend application was using S3 + CloudFront CDN with cache invalidation strategies, ensuring updated assets were published post-integration.
- We enabled session replay, click tracking, heatmaps, and frontend error capture allowing immediate debugging of UX issues in production with full user journey context and performance correlation.
Logs Aggregation & Correlation:
- We centralized logs from all environments using Datadog Agents on ECS/EC2 and Kubernetes clusters, processing 500GB+ daily log volume. We configured advanced log parsing rules, custom log pipelines, and structured logging (JSON format) at the application level.
- We leveraged log correlation with APM traces using trace IDs, enabling seamless root-cause analysis across distributed services and reducing debugging time by 70%.
Infrastructure & Custom Monitoring:
- We installed Datadog agents on 25+ Linux servers and monitored databases (MongoDB, PostgreSQL, Redis) via native integrations with custom query monitoring.
- We created over 80+ custom monitors (thresholds, anomaly detection, service checks, SLO tracking) to track CPU, memory, disk usage, request latency, error rates, database performance, and application-specific business metrics.
- We implemented intelligent alerting via email, Slack, PagerDuty, and webhook integrations with escalation policies and alert fatigue reduction strategies.
Dashboards & Business KPIs:
- We designed 15+ interactive, role-specific dashboards for DevOps, SREs, product teams, and business stakeholders.
- We integrated Datadog anomaly detection to automatically flag deviations in key metrics like transaction success rate, response time, throughput, and revenue-impacting events.
- We used runtime metrics derived from traces and logs to monitor critical business workflows, A/B test performance, and conversion funnel analytics.
Results:
- The solution reduced mean time to detect (MTTD) from 45 minutes to 3 minutes and mean time to resolve (MTTR) by over 75% (from 4+ hours to <1 hour), enabled proactive issue identification preventing 12+ production incidents, and provided actionable insights during Black Friday traffic spikes (3x normal load).
- All configurations were version-controlled via Terraform/Helm and automated via CI/CD pipelines, ensuring consistency, auditability, and disaster recovery capabilities.
- This project demonstrates deep expertise in cloud-native observability, distributed tracing, infrastructure-as-code (IaC), SRE practices, and real-time monitoring strategy — essential for modern, scalable applications handling enterprise-scale traffic and business-critical workloads.
Features
This project delivered a unified, intelligent observability platform across a complex, multi-environment microservices ecosystem — enabling real-time visibility, rapid incident response, and deep user experience insights.
Core Capabilities:
- Unified Observability Stack: Integrated APM, RUM, logs, infrastructure metrics, and custom business KPIs into a single pane of glass.
- Distributed Tracing Across Services: Full end-to-end trace visibility across 15+ microservices with service dependency mapping and latency analysis.
- Real User Monitoring (RUM): Captured frontend performance (load time, JS errors), user behavior (clicks, heatmaps), and Core Web Vitals directly from production browsers.
- Cross-Service Log Correlation: Linked application logs to APM traces using trace IDs — reducing debugging time by 70%.
- Smart Alerting & Incident Management: Configured over 80+ custom monitors with anomaly detection, SLO tracking, escalation policies, and alert fatigue reduction.
- Multi-Environment Consistency: Applied identical monitoring configurations across dev, staging, and production via Infrastructure-as-Code (IaC).
- Proactive Detection: Anomaly detection flagged deviations in transaction success rate, error rates, and throughput before they impacted users.
- Business Impact Visibility: Dashboards tied system performance to key business outcomes (e.g., conversion funnels, revenue events).
- Automated CI/CD Deployment: All Datadog configurations version-controlled and deployed via Terraform/Helm pipelines for auditability and disaster recovery.
Outcome:
Reduced MTTD from 45 min → 3 min, MTTR from >4 hours → <1 hour, and prevented 12+ critical incidents through early detection.
Technologies
A modern, cloud-native stack leveraging AWS and industry-leading observability tools.
Layer | Technology |
Observability Platform | Datadog (APM, RUM, Logs, Monitors, Dashboards, Session Replay) |
Compute & Orchestration | AWS EC2, ECS (Fargate & EC2 launch type), EKS (Kubernetes), Lambda (serverless) |
Frontend Delivery | React/Angular + S3 + CloudFront CDN with cache invalidation |
Secrets Management | AWS Secrets Manager (for Datadog API keys) |
CI/CD & Automation | GitHub Actions, Serverless Framework, Terraform, Helm |
Infrastructure as Code (IaC) | Terraform (AWS resources), Helm (EKS manifests) |
Monitoring Agents | Datadog Agent (sidecar on ECS), DaemonSet (EKS), Lambda layer (serverless) |
Data Processing | Custom log parsing rules, JSON structured logging, trace correlation |
Alerting Channels | Email, Slack, PagerDuty, Webhooks with escalation policies |
Bonus Tools Used: OpenTelemetry (for future extensibility), Grafana (optional dashboards), X-Ray (used for comparison during evaluation phase).
Security Model
Built with security-first principles to protect sensitive telemetry and ensure compliance.
Key Security Controls:
Secure Credential Handling:
- Datadog API keys stored in AWS Secrets Manager, retrieved via IAM roles.
- No hard-coded secrets in code or config files.
Least Privilege Access:
- IAM roles assigned to EC2/ECS/EKS agents with minimal permissions.
- Restricted access to Datadog account via SSO and MFA.
Network Isolation:
- Agents communicate securely over HTTPS only.
- No public internet exposure; all traffic routed through private subnets.
Data Privacy & Compliance:
- PII scrubbing enabled in logs and RUM data (via regex masking).
- GDPR/HIPAA-ready configuration options implemented.
- Audit trail via CloudTrail and Datadog event logs.
Session Replay Security:
- Optional opt-in for session recording.
- Data anonymized where possible; stored encrypted at rest.
Aligned With: SOC 2 Type II, ISO 27001, HIPAA (with BAA), NIST SP 800-53
Data Types & Standards
The system processes high-volume, sensitive operational and user-facing data under strict regulatory frameworks.
Data Types Handled:
- Application Performance Metrics: Request duration, error rate, throughput, CPU/memory per service.
- Traces & Dependencies: Distributed spans showing call flow between services.
- User Experience Data (RUM):
- Page load time, TTFB, FID, CLS, LCP
- JavaScript errors, DOM interactions, click paths
- Session replay (opt-in)
- Logs: Structured JSON logs from apps, servers, databases, and containers (~500GB/day).
- Infrastructure Metrics: Host-level metrics (CPU, disk, network), container stats, database query performance.
- Business KPIs: Transaction success/failure, checkout funnel drop-off, revenue impact.
Regulatory & Industry Standards:
Standard | Application |
SOC 2 | Trust Services Criteria (Security, Availability, Confidentiality) |
HIPAA | If handling health-related data (with BAA) |
GDPR | For EU users; PII masking, consent controls |
NIST SP 800-53 | Control mapping for federal systems |
OpenTelemetry | Future-proofing trace format compatibility |
Note: All PII/PHI is masked or excluded from logs/RUM based on policy.
Infrastructure Architecture
Designed for scalability, resilience, and consistency across environments.
Environment Structure:
- Regions: us-east-1 (primary), us-west-2 (DR option)
- Environments: dev, staging, production (separate Datadog environments/accounts)
Network & Compute Topology:
Service | Deployment Method | Security & Configuration |
EC2 | Datadog Agent installed via user-data scripts | IAM role attached; logs sent via UDP/TLS |
ECS | Sidecar container (datadog-agent) in task definitions | API key from Secrets Manager via IAM role |
EKS | Datadog Operator + DaemonSet | Helm chart managed via IaC; RBAC enforced |
Lambda | Custom Serverless Framework plugin injects Datadog layer at deploy time | Auto-injected via build pipeline |
Frontend (React/Angular) | RUM script injected via CDN (CloudFront) | Secure CSP headers; no inline scripts |
Data Flow:
[Microservices] ↓ (APM Tracing)[Datadog Agents / Lambda Layer] ↓[Datadog Ingestion Pipeline] ↓→ APM Traces (distributed)→ Logs (parsed, enriched)→ RUM Events (user sessions)→ Infrastructure Metrics ↓[Correlation Engine: Trace ID → Log → Metric] ↓[Dashboards, Alerts, Anomaly Detection]
Operational Resilience:
- Backpressure Handling: Datadog agent throttles if overwhelmed.
- Auto-Scaling: Agents scale with node count (EKS) or instance count (EC2/ECS).
- Disaster Recovery: IaC ensures quick recreation of entire monitoring stack.
- Rollback Capability: Terraform allows reverting changes safely.
Summary Table
Category | Details |
Project Title | End-to-End Datadog Monitoring & Observability Integration |
Industry | Enterprise Software / Digital Services |
Role | Architect & Tech Lead |
Duration | ~12–18 months (estimated completion: Q4 2025) |
Core Goal | Unified observability across 15+ microservices in multi-env AWS setup |
Key Outcome | MTTD ↓ 93%, MTTR ↓ 75%, 12+ incidents prevented |
Compliance | SOC 2, HIPAA (with BAA), GDPR, NIST SP 800-53 |
Volume | 500GB+ logs/day, 10k+ traces/hour, 100k+ RUM sessions/day |
Latency Target | < 5 sec for trace ingestion, < 1 min for alert delivery |
Skills
- Datadog (APM, RUM, Logs, Monitors, Dashboards)
- AWS (ECS, EKS, Lambda, EC2, S3, CloudFront, Secrets Manager)
- Serverless Framework & CI/CD Pipelines
- Kubernetes & Helm (EKS)
- Distributed Tracing & OpenTelemetry Concepts
- Infrastructure as Code (IaC)
- Log Management & Correlation
- Real User Monitoring (RUM)
- Anomaly Detection & Alerting Strategies
- Microservices Observability
- System Design & Scalable Architecture
Final Thoughts
This project exemplifies modern SRE practices in action — turning fragmented monitoring into a proactive, intelligent, and business-aligned observability engine.
By combining distributed tracing, real-user insights, automated alerts, and IaC-driven consistency, the solution not only fixed immediate pain points but also laid the foundation for scalable, resilient, and self-healing systems.